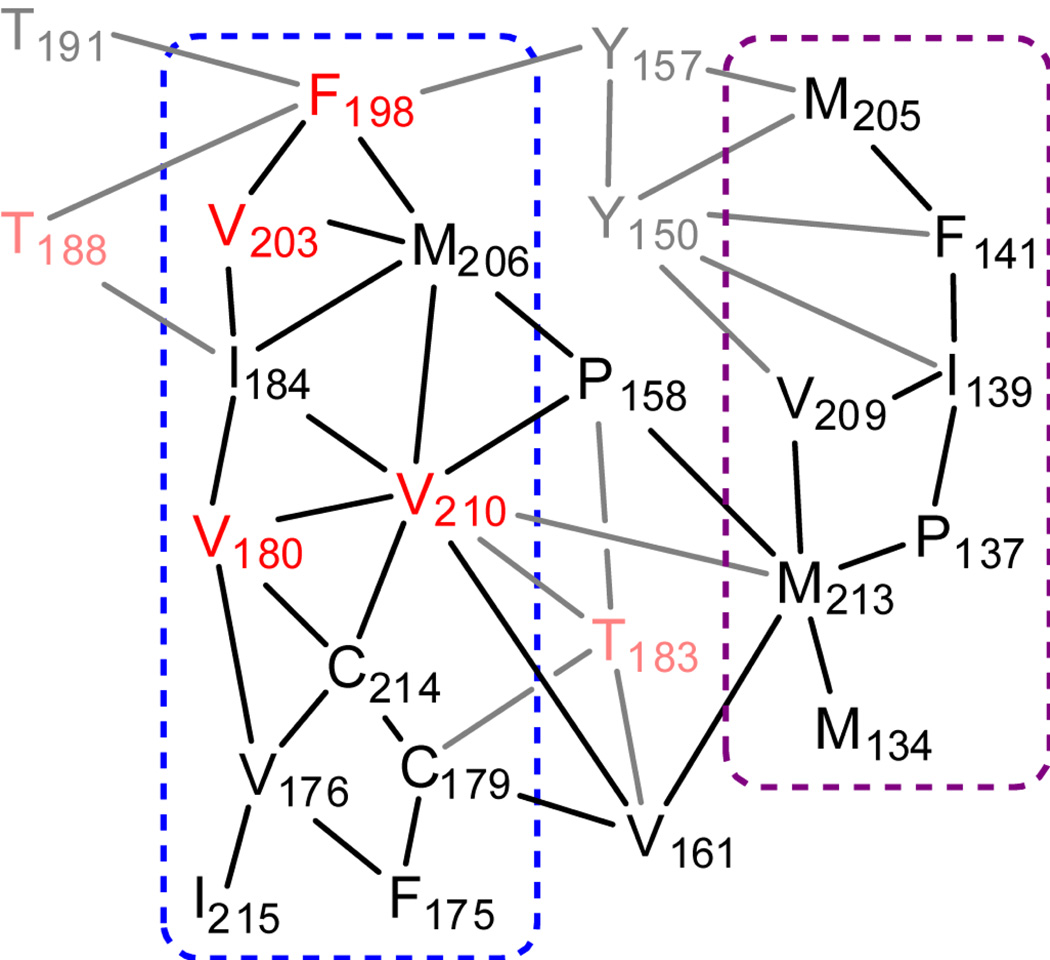
Figure 2.
Schematic depiction of hydrophobic interactions in human PrP. Names of residues that are part of the hydrophobic core (with purely hydrophobic side chains) are shown in black, or, if implicated in disease-causing mutations, in red; other residues involved in the hydrophobic core are shown in gray, or, if implicated in disease-causing mutations, in pink. The blue dashed line indicates interactions between residues in HB and HC and the purple dashed line indicates interactions between HC and the S1-HA loop.

