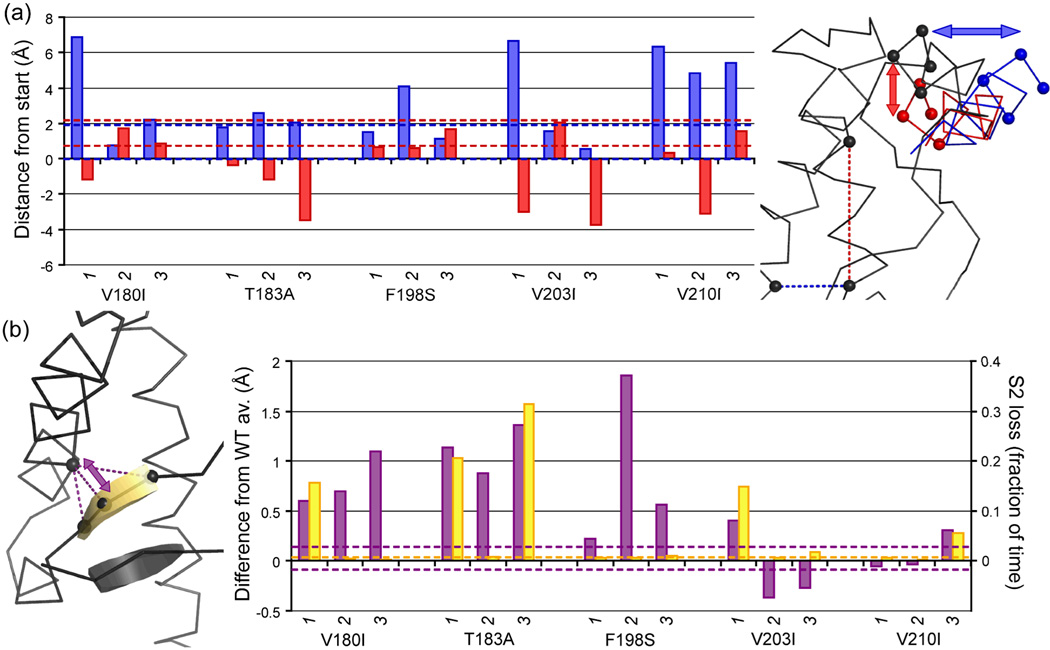
Figure 5.
Displacement of HA and the native β-sheet. (a) Average outward (blue) and downward (red) displacement of the N-terminal part of HA (measured as displacement of Cα atoms of res. 144–147, shown as spheres) over 25–50 ns. Downward movement is relative to the axis through C214 and M206 (spheres connected with red dashed line), outward movement relative to axis through C214 and V176 (spheres connected with blue dashed line); structure alignment was performed on the ‘core’ region (res. 174–186 & 200–219). (b) Distance between S2 and Cys179 (purple) and the fraction of time S2 is lost (yellow; S2 is neither β-strand nor β-bridge according to DSSP) over 25–50 ns. Extreme values observed in the WT runs are shown as dashed lines in the histograms.

