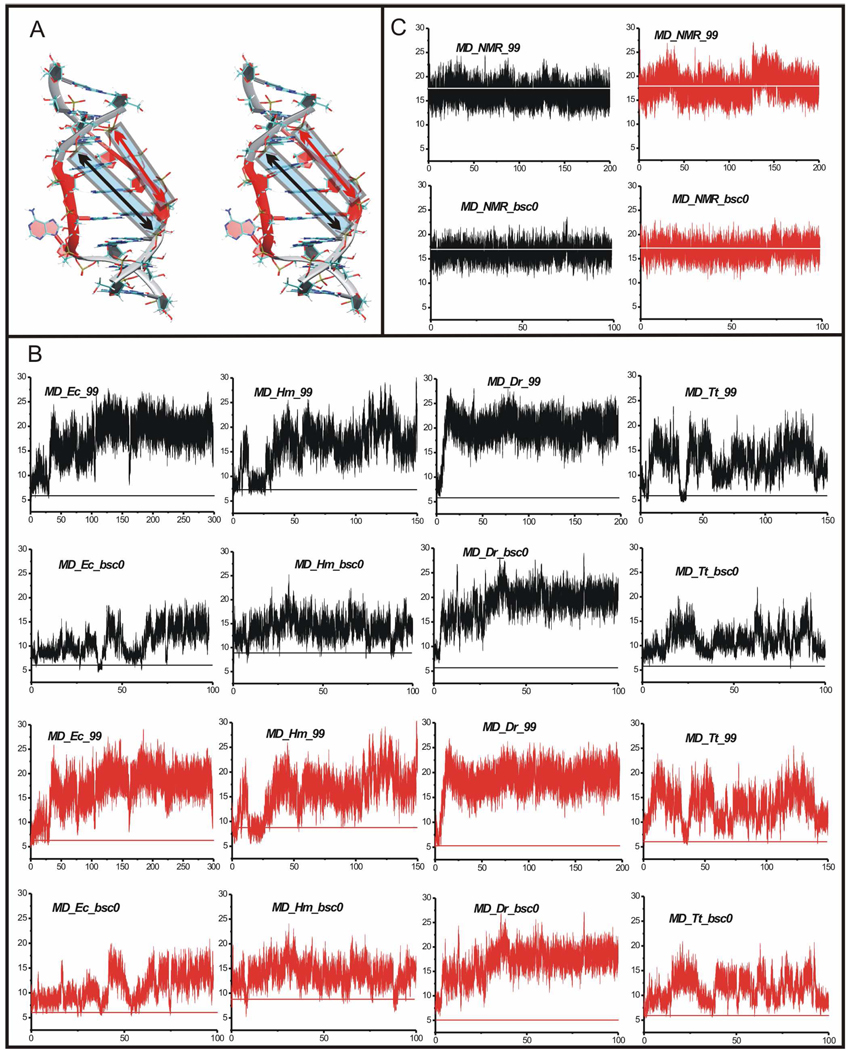
Figure 4.
A. Stereo view of the averaged 55–57 ns MD structure of the simulated X-ray H40 UAA/GAA internal loop from the MD_Ec_99 simulation. The structure exhibits wider (more open) major groove compared to the original geometry (see Figure 1A). Monitored inter-phosphate distances across the major groove are indicated by black (12P-3P) and red arrows (11P-4P) in blue transparent boxes. B. Time courses of two inter-phosphate distances (12P-3P in black and 11P-4P in red) in standard MD simulations of X-ray H40 run with the parm99 force field and in control simulations run with the parmbsc0 force field, all with net-neutralizing Na+ (Table 1). The x-axis stands for time (in nanoseconds) while y-axis stands for inter-phosphate distance (in Å). Horizontal lines show experimental distances. C. Time course of two inter-phosphate distances (12P-3P in black and 11P-4P in red) in standard MD simulation of NMR structure run with the parm99 force field and in control simulation run with the parmbsc0 force field.

