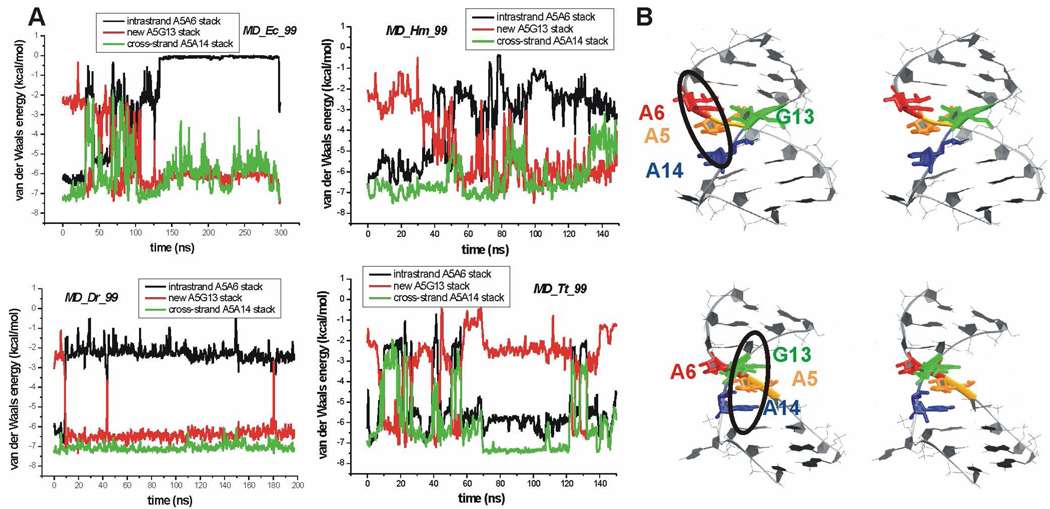
Figure 5.
A. Time courses of the van der Waals interaction energy calculated between bases forming A5A6, A5A14 and A5G13 stacks in the standard simulations of X-ray H40 run with parm99 force field. B. Stereo views of X-ray H40 UAA/GAA internal loop with colored bases forming stacks. Top – the original stacking pattern highlighted by the black oval, i.e. A5 forms an intrastrand stack with A6, and simultaneously cross-strand stack with A14. Bottom – the stacking pattern formed in the course of the simulations (highlighted by the black oval) where A5 stacks with G13 and also with A14.

