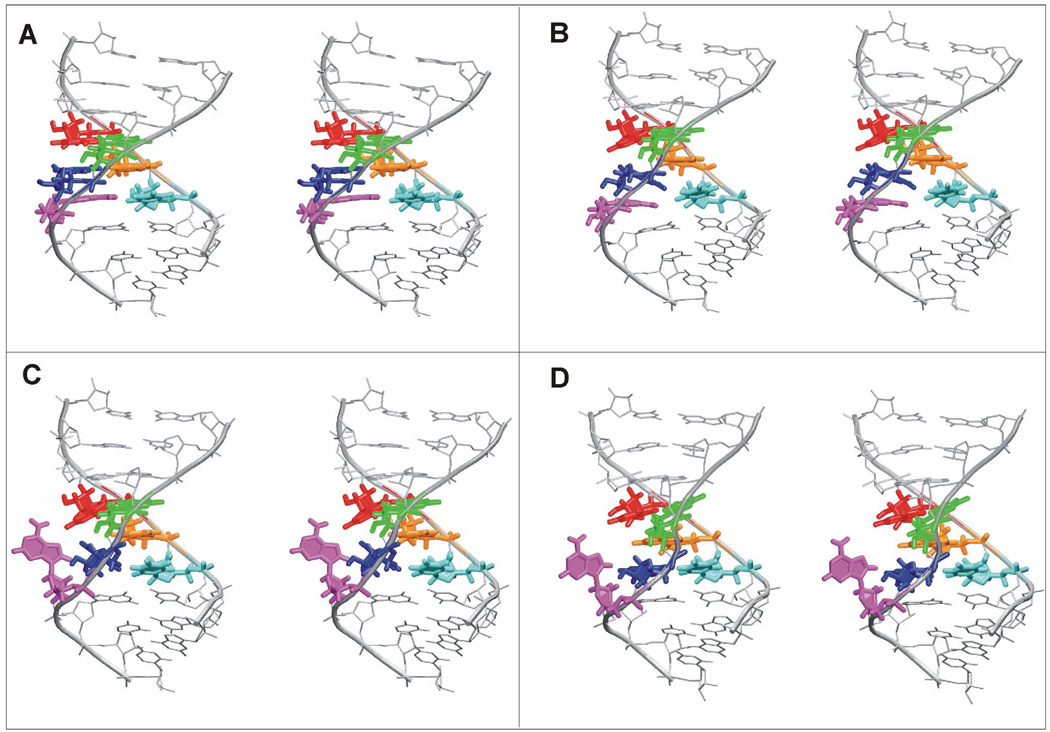
Figure 9.
3D stereo view of structures showing the conformational transition between NMR and X-ray structures predicted by NEB calculations. G13 is highlighted in red, A6 in green, A14 in blue, A5 in yellow, A15 in magenta and U4 in cyan. A) Starting NMR structure. B) Intermediate structure where the A14/A5 pair breaks and moves away from being stacked with A6 and A15. C) Intermediate structure where A15 slides out of the helix to become bulged out. D) Final structure where A14 pairs with U4 while A5 is unpaired and stacks with A6. This structure corresponds to the arrangement of the H40 X-ray structure.

