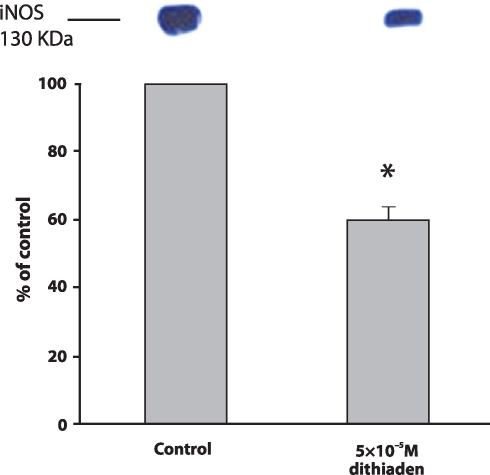
Figure 2.
The expression of iNOS in the cell lysates from RAW 264.7 cells stimulated by 0.1 µM LPS after 24 hour incubation with 5×10⁻⁵ M dithiaden at 37°C in comparison with non-treated cells (control). Data are expressed as percentages of the control. Values represent mean ± SEM, n=3. Asterisks show significant differences as compared to control, p<0.05 was considered as statistically significant as compared to control.

