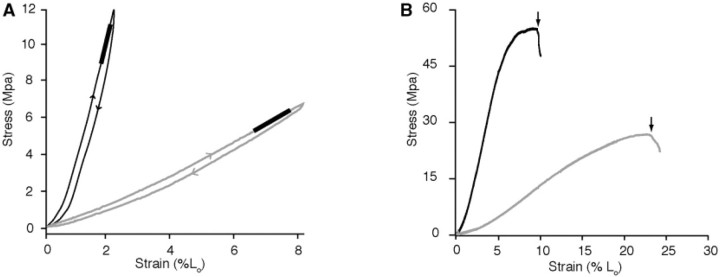
Fig. 3.
Sample stress–strain plots from (A) cyclical loading and (B) failure tests. (A) Stress–strain curves of cyclical loading tests used to characterize the elastic modulus and the resilience of samples oriented in the longitudinal (black) and transverse (gray) directions. The linear region of the extension portion of each curves is fit by linear regression (thick line), the slope of which is used to characterize the tissue's Young's modulus. Note the difference in stiffness between the longitudinal and transverse directions. The plotted loops also show the energy dissipated during the cycle, which can be quantified as the area within each loop. (B) Stress–strain plots of samples oriented in the longitudinal (black) and transverse (gray) directions stretched until failure. Arrows indicate the stress and strain at which the tissue failed. The plots show that tissue samples oriented in the transverse direction fail at a lower stress and higher strain than in the longitudinal direction.

