Figure 3.
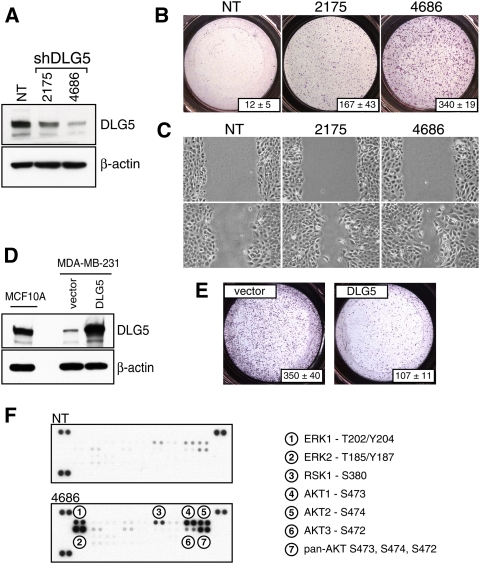
DLG5 regulates cell migration. (A) Immunoblot analysis of DLG5 knockdown in MCF10A cells using two independent shRNAs. (B) DLG5 knockdown in MCF10A cells leads to induction of cell migration as assayed by Boyden chambers. Numbers in the bottom right of each panel represent quantitation of the migration phenotypes and are derived by counting individual cells in three representative fields. (C) DLG5 knockdown in MCF10A cells leads to induction of cell migration, as assessed by wound scratch assays. (D) Immunoblot analysis showing DLG5 overexpression in MDA-MB-231 cells and its relative level in comparison with MCF10A cells. (E) DLG5 overexpression in MDA-MB-231 cells results in inhibition of cell migration. Numbers in the bottom right of each panel represent quantitation of the migration phenotypes and are derived by counting individual cells in three representative fields. (F) The phospho-specific antibody array identifies activation of multiple signaling pathways upon DLG5 knockdown using the best available hairpin.

