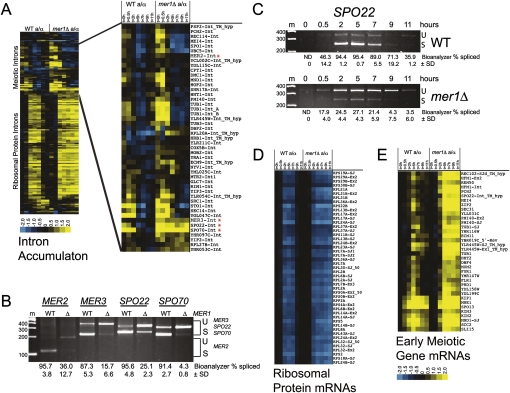
Figure 1.
Meiotic gene expression in the absence of the Mer1p splicing factor. (A) Splicing changes as represented by intron accumulation indexes (Clark et al. 2002) during the time course of wild-type (left panel) and mer1Δ (right panel) meiosis. The asterisk (*) indicates introns whose splicing efficiency during meiosis is reduced in mer1Δ cells compared with wild type. Yellow represents an increase in the intron accumulation index, and thus a decrease in splicing efficiency. Blue represents an increase in splicing efficiency. (B) RT–PCR validation of MER2, MER3, SPO22, and SPO70 splicing efficiencies in wild-type (WT) and mer1Δ yeast 5 h after induction of meiosis. (C) Expression and splicing of SPO22 mRNA during meiosis in wild-type (WT) and mer1Δ strains. (D) RP gene expression during meiosis in wild-type (left panel) and mer1Δ (right panel) cells. Blue represents decrease in expression. (E) Expression of early meiotic genes in wild-type (left panel) and mer1Δ (right) cells. Yellow represents increase in expression. For B and C, “U” indicates unspliced pre-mRNA and “S” indicates spliced mRNA. Marker sizes are in base pairs. Splicing efficiency was calculated as described in the Materials and Methods.

