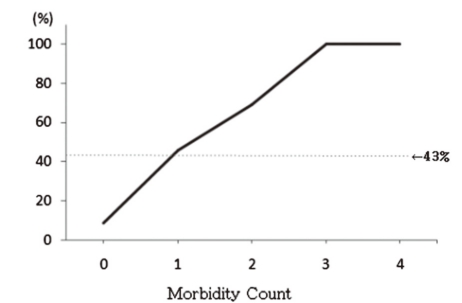
Fig. 1.
Probability of poor outcome in the study infants with 0, 1, 2, 3 and all 4 neonatal morbidities. Observed rates of poor outcome between 18-24 months of corrected age. Solid line indicates predictions based on the fitted morbidity count model; dotted line (←), the overall probability of a poor outcome between 18-24 month of corrected age (43%).

