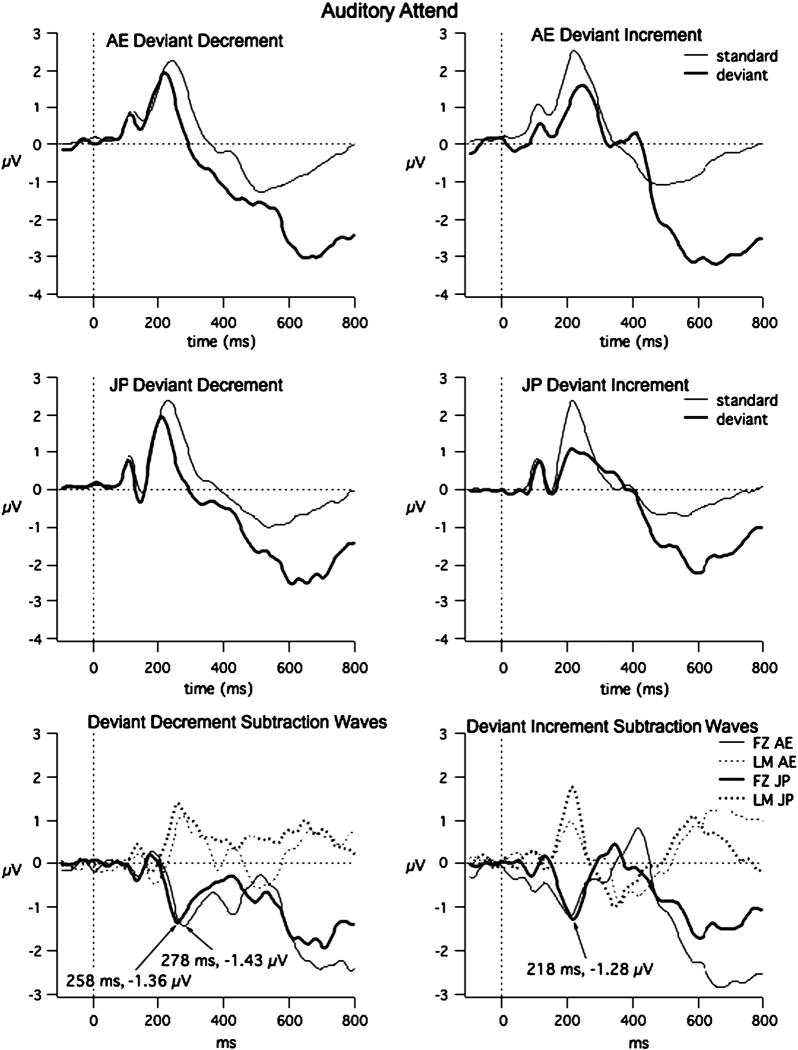
Fig. 3.
Auditory-Attend Grand Average data (FZ): the grand average at the mid-frontal site (FZ) for the standard, deviant and deviant-standard and at LM for the deviant-standard for all four contrasts and for AE (top a) and JP (bottom b) are shown above. Latency and amplitude are shown for peak negativities of the subtraction waves. It illustrates across-group responses.

