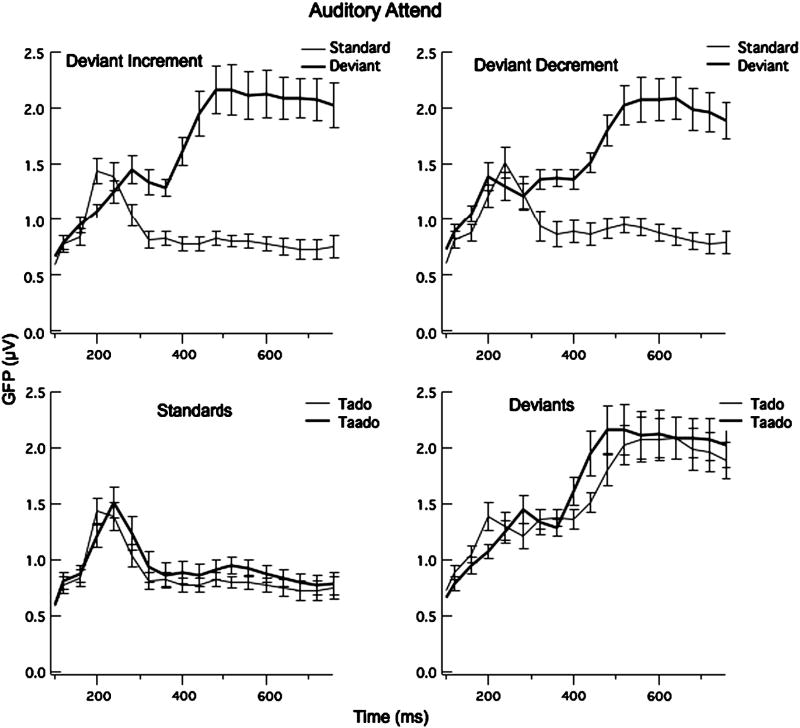
Fig. 4.
Mean Global Field Power and Standard Error bars for the 24 participants for the Auditory Attend Task comparing the Standard and Deviant stimuli in the Deviant Increment (left graph) and Deviant Decrement (right graph) conditions. The bottom graphs compare the short and long standards and short and long deviants.

