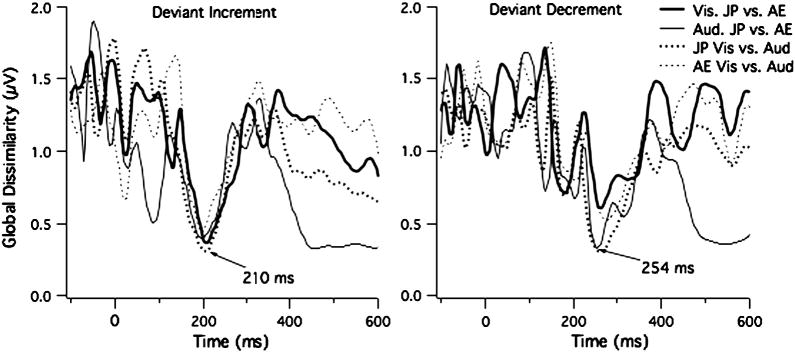
Fig. 6.
Global Dissimilarity Index (GDI) for each time point for the Deviant Increment and Deviant Decrement. Higher Values indicate greater dissimilarity in topography. Values < 1 are equivalent to Pearson's r > 0.5. The lowest values are found near the MMN peak, indicated similar topographies across groups and tasks for the MMN.

