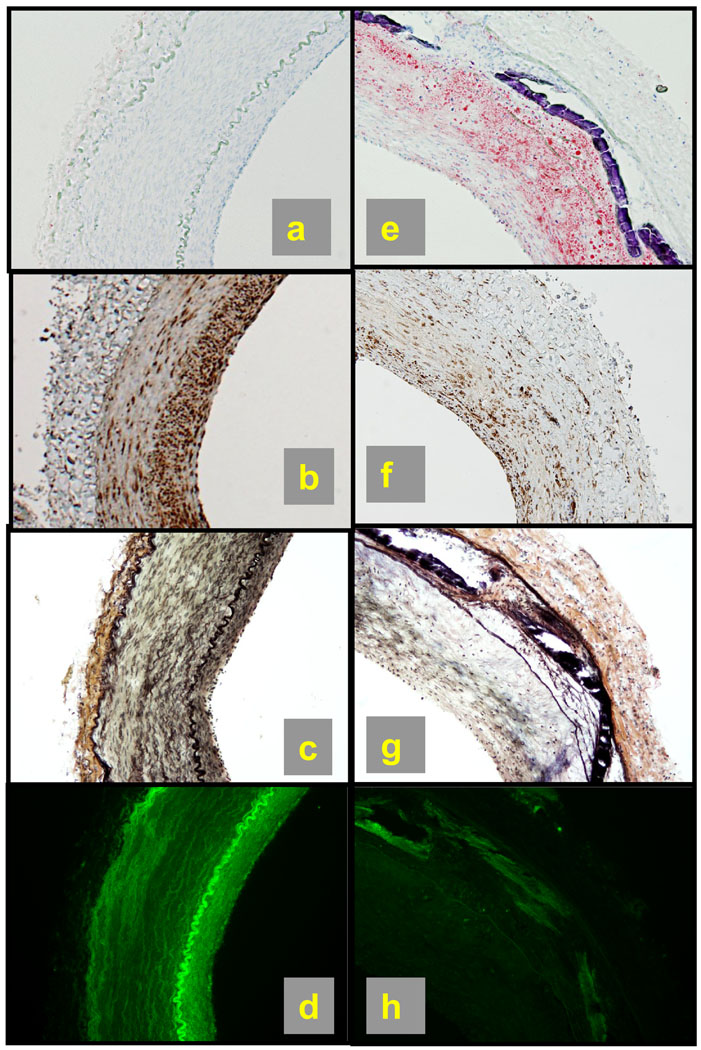
Figure 3.
Arterial ultrastructure determines drug distribution. Control or atherosclerotic arteries were incubated for 24h in fluorescent drug, serial sectioned and either analyzed for compositional distribution or imaged en face using a fluorescent microscope to determine drug distribution. (a,e) oil-red-O stain for lipid. (b,f) tubulin immunostain in brown; (c,g) VerHoeff stain shows elastin as black wavy lines; (d,h) fluorescent paclitaxel deposition (green). Diet and injury decreased total elastin and tubulin levels by 40±5% and 37±5%, respectively. Concomitantly, total fluorescent paclitaxel deposition dropped 73±9% and total lipid levels increased by 28±7%.

