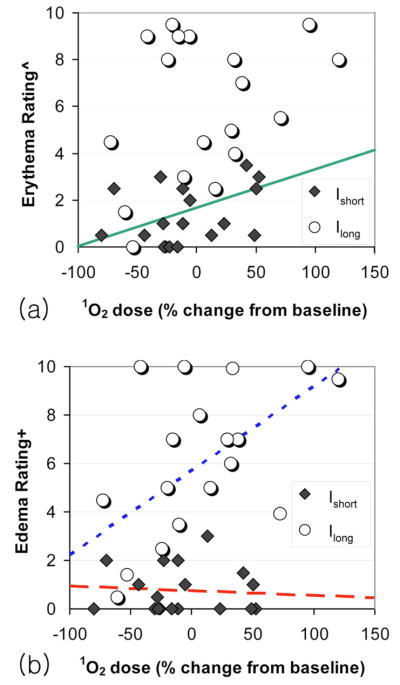
Fig. 2.
Scatter plots illustrating the relationship between 1O2 luminescence signal versus (a) acute edema rating and (b) erythema rating 24 h after PDT. Regression-based fits to the Ishort, Ilong, and combined data are shown by the red dashed line, the blue dotted line, and the solid green line, respectively. (Color online only.)

