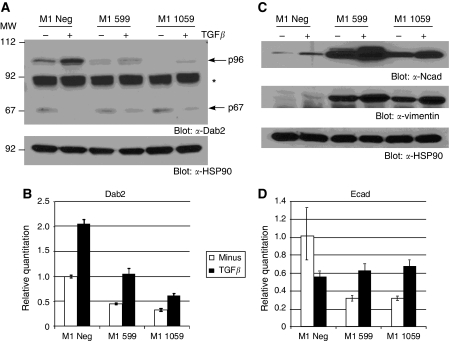
Figure 2.
Downregulation of Dab2 leads to constitutive EMT. (A) Cell lysates were prepared from untreated or cells treated with 2.5 ng ml−1 TGFβ for 48 h followed by western blot analysis for Dab2 expression as described in Materials and Methods. Equal protein loading is demonstrated by western blot analysis for HSP90. Arrows indicate the position of the p96 and p67 Dab2 isoforms; Asterisk indicates a non-specific band. (B, D) Detection of Dab2 or E-cadherin by qRT–PCR analysis in untreated and cells treated with 2.5 ng ml−1 TGFβ for 48 h was performed as described in Materials and Methods. Quantitation is expressed relative to levels in untreated M1 Neg cells, which is set to 1.0. Shown is the mean expression value ±s.d. from an individual experiment; n=3 independent experiments. (C) Upregulation of EMT marker proteins following knockdown of Dab2. Cell lysates from unstimulated or cells treated with 2.5 ng ml−1 TGFβ for 48 h were subjected to western blot analysis for N-cadherin (Ncad) and vimentin expression as described in Materials and Methods. HSP90 expression by western blot analysis demonstrates equal protein loading (n=3 independent experiments).

