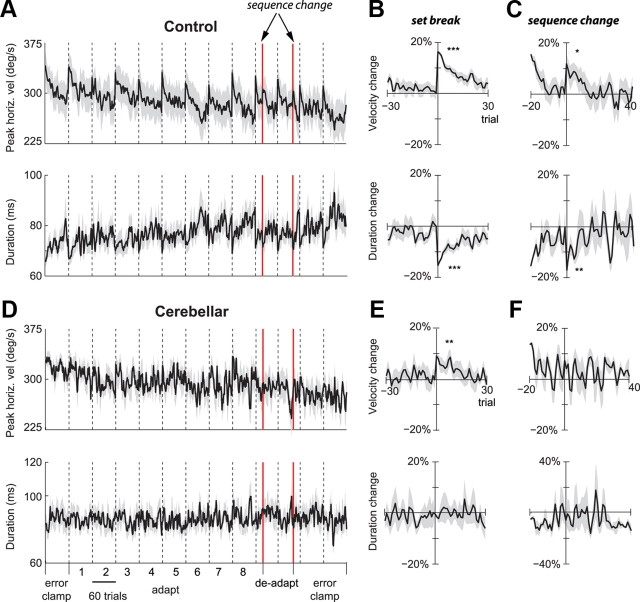
Figure 4.
Effect of set breaks on saccade horizontal velocities and durations. A, D, Peak vertical velocity and duration, averaged across each group. Dotted vertical lines mark set boundaries. Each set consisted of 60 trials. Red lines mark sudden changes in target sequence that occurred within sets without breaks. B, E, Within-subject changes in peak velocity and duration, aligned to set restart. The plots show percentage change with respect to the last bin of each set. The amount of recovery is calculated as the difference between the last and first bins (t test, *p < 0.05, **p < 0.01, ***p < 0.001). Shading indicates across subject SEM. C, F, Within-subject changes in peak velocity and duration, aligned to the sudden change in sequence of targets from CCW to CW cross-axis target jumps. A–C are control data, and D–F are cerebellar data.

