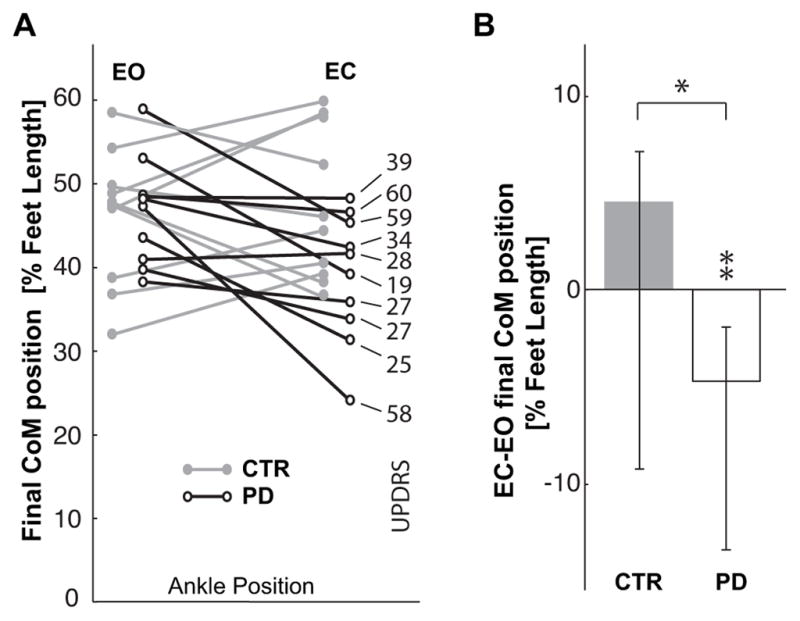
Fig. 5.

A. Comparison of final anterior-posterior position of the CoM in front of the ankle joints, CoMx, for the CTR and PD groups. Data are reported as percentage of foot length for the EC and EO conditions, so that the ordinate 0 value corresponds to the ankle position and 100 represents the limit of the base of support. On the right, the UPDRS score of each PD subject is related to their corresponding CoM displacement. B. Median values of the individual differences between the EC and EO condition for CTR and PD subjects. Zero on the ordinate axis corresponds to no effect of eyes closure. ** indicates a significant effect (p<0.01) of eyes closure for the subjects with PD. * indicates significant difference (p<0.05) in the effect of the eyes closure between the groups.
