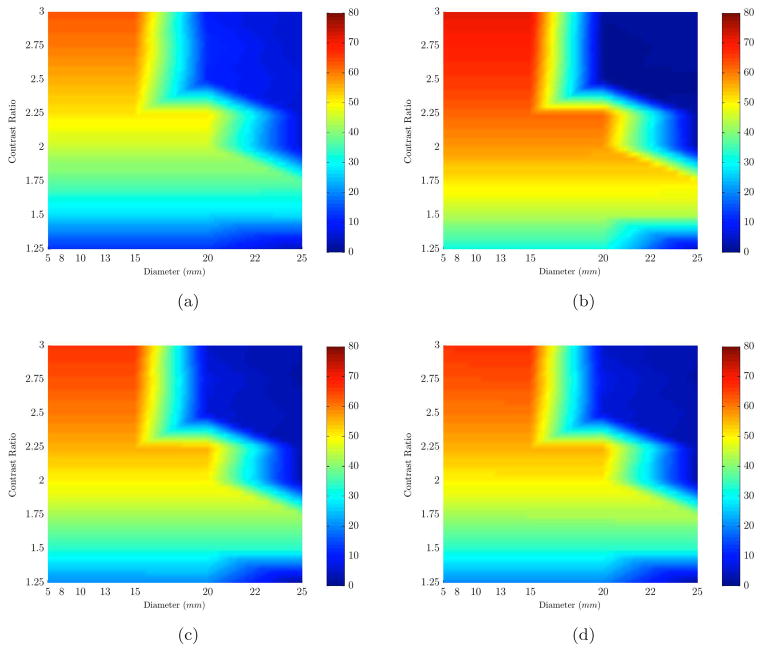
Fig. 4.
Percent error plots (color bar shows error values) are shown for the range of sizes (x-axis) and contrasts (y-axis). Each plot represents the error in recovering an expected value of a different chromophore based on varying sizes (x-axis) and contrasts (y-axis): (a) HbO, (b) Hb, (c) HbT, (d) Contrast Ratio. The results are for spherical inclusions (with water contrast) whose sizes were smaller than that of non-spherical inclusions shown in Figures 2 and 3.

