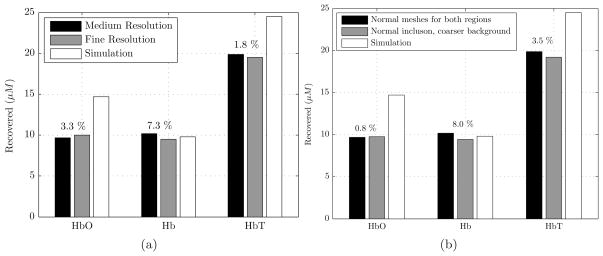
Fig. 7.
(a) Reconstructed estimates of HbO, Hb and HbT concentration are shown for a simulated inclusion with an equivalent diameter of 19.2mm. The resolution of the inclusion mesh was doubled. The difference in HbT was less than 2% using different mesh resolutions. The numbers shown on top of each set of bars are the % error of the medium resolution relative to the fine resolution. Refer to Table 4 for mesh information. (b) Using a relatively coarser mesh for the breast model not only produces accurate chromophore values but also it reduces computational time relative to normal breast mesh. The numbers shown on top of each set of bars are the % error of each chromophore of the coarse breast mesh relative to normal breast mesh. Refer to Table 5 for the mesh information used here.

