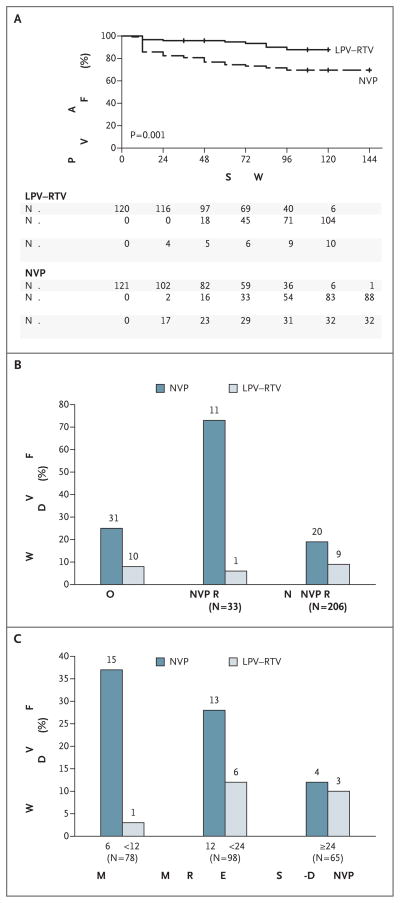
Figure 2. Primary End Point According to Treatment Group in Trial 1.
The Kaplan–Meier plot in Panel A shows the proportions of participants in the ritonavir-boosted lopinavir (LPV–RTV) group and the nevirapine (NVP) group who were alive and free of virologic failure at the end of the study. Panel B shows the proportions of women for whom resistance results were available (239) who reached a primary end point in the overall study population and according to the presence or absence of baseline nevirapine resistance. Panel C shows the proportions of women who reached a primary end point according to the time since the most recent exposure to single-dose NVP. Numbers above bars indicate numbers of women.

