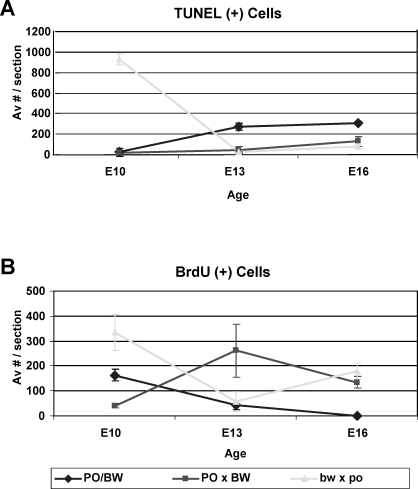
FIG. 7.
Quantitation of BrdU (A) and TUNEL (B) assays. Average number of positive cells per section is shown for each genotype (indicated in key); bars indicate standard error. Significant differences (P < 0.001) in A are female bw × male po (from the other two classes) at E10 and both hybrid types (from PO/BW) at E13 and E16. All classes significantly differ from each other in B except female bw × male po from PO/BW at E13 and the two hybrid types from each other at E16 (all ages are Mus equivalent).

