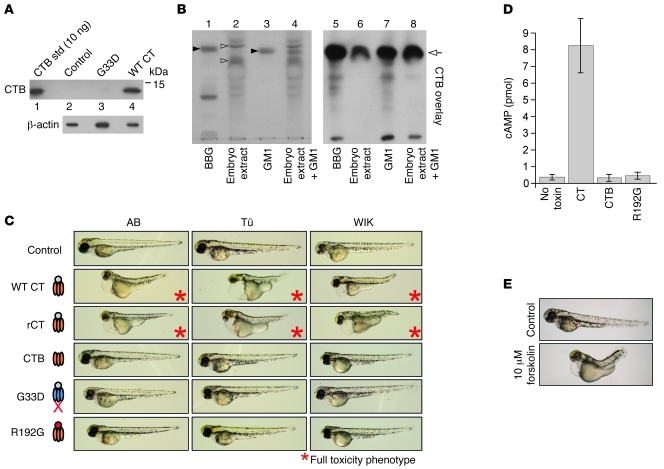
Figure 2. Zebrafish embryos model the pathways co-opted by CT to induce toxicity in mammalian cells.
(A) Protein lysates were prepared from pools of five 16-hpf embryos incubated 1 hour with no toxin (control), 5 nM WT CT, or 5 nM G33D and analyzed for CTB and β-actin by immunoblot. Purified CTB was loaded as standard (std). (B) Total gangliosides from 16-hpf zebrafish embryos (embryo extract) or bovine brain gangliosides (BBG) were analyzed by TLC along with GM1 authentic standard (left panel). The GM1 standard and embryo extract were combined and also analyzed (lane 4). Filled arrowheads indicate resorcinol-staining GM1 band in GM1 standard and BBG. A portion of these extracts were subjected to CTB overlay immunoblot analysis (right panel). (C) Embryos (16-hpf) from 3 parental zebrafish strains (AB, Tü, and WIK) were incubated with embryo water alone (control) or with the indicated toxins at 5 nM for 48 hours. Only WT CT produced in V. cholerae or E. coli (CT and rCT, respectively) induced toxicity (asterisks). Toxin schematics at left indicate mutations in the G33D B-subunit and R192G A-subunit. n ≥ 50 for each intoxicated strain; images are representative of at least 95% of the population. (D) Embryos were intoxicated as indicated (5 nM) or mock treated (no toxin) as in C and assayed at 48 hpf for total cAMP content by ELISA. Results from pools of 10 embryos/condition from 3 independent experiments are represented as mean ± SD. (E) Embryos (16-hpf) were treated with vehicle (control; 0.01% DMSO, n = 85) or 10 μM forskolin (n = 57) and imaged at 62 hpf (images representative of 100% of each population).

