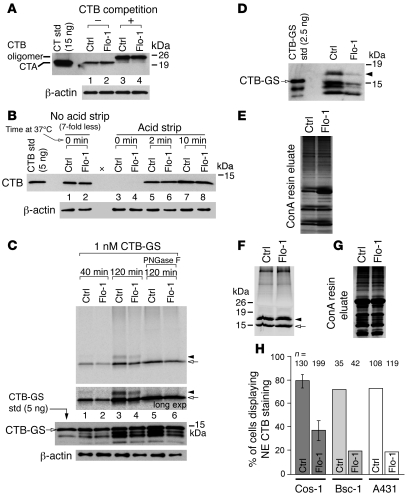
Figure 6. The flotillins affect sorting of CT into two pathways to the ER, only one intersecting the TGN.
(A) Cos-1 cells transfected with control or flotillin-1 siRNA were incubated with CT or CT plus CTB and protein extracts immunoblotted for CTA. (B) Cells transfected as in A were incubated with CT at 37°C for the indicated times. CTB was immunoprecipitated and immunoblotted using anti-CTB pAb. That no CTB was detected in lanes 3 and 4 indicates that virtually all the CTB was removed from the cell surface. Blank lane indicated by x. (C) Phosphorimage (top panels) of control or flotillin-1–depleted cells intoxicated for the indicated times with CTB-GS. Arrow indicates non-glycosylated CTB-GS and arrowhead the glycosylated form. A fraction of the post-IP eluate was analyzed for CTB by immunoblot (third panel). Intact CTB-GS is indicated by arrow (lower-MW forms are degradation products). (D) Immunoblot of post-ConA eluates from control or flotillin-1 siRNA cells intoxicated with CTB-GS. The glycosylated, higher-MW form is indicated by an arrowhead. Non-glycosylated CTB-GS is also present. (E) A fraction of the post-ConA eluates from D were analyzed by silver stain. (F) Phosphorimage of post-ConA eluates from Ctrl or flotillin-1 siRNA–treated cells preincubated with 35S-sulfate and subsequently intoxicated with CTB-GS. Arrow indicates non-glycosylated CTB-GS and arrowhead the glycosylated form. (G) Samples in F were also analyzed by silver stain. (H) Random, intoxicated cells were analyzed for the percentage of cells demonstrating colocalization of fluorescently labeled CTB and PDI at the NE (mean ± SEM; 6 independent experiments for Cos-1 cells and single experiments shown for Bsc-1 and A431 cells; number of cells imaged [n] is indicated). See Methods and Supplemental Video 3.

