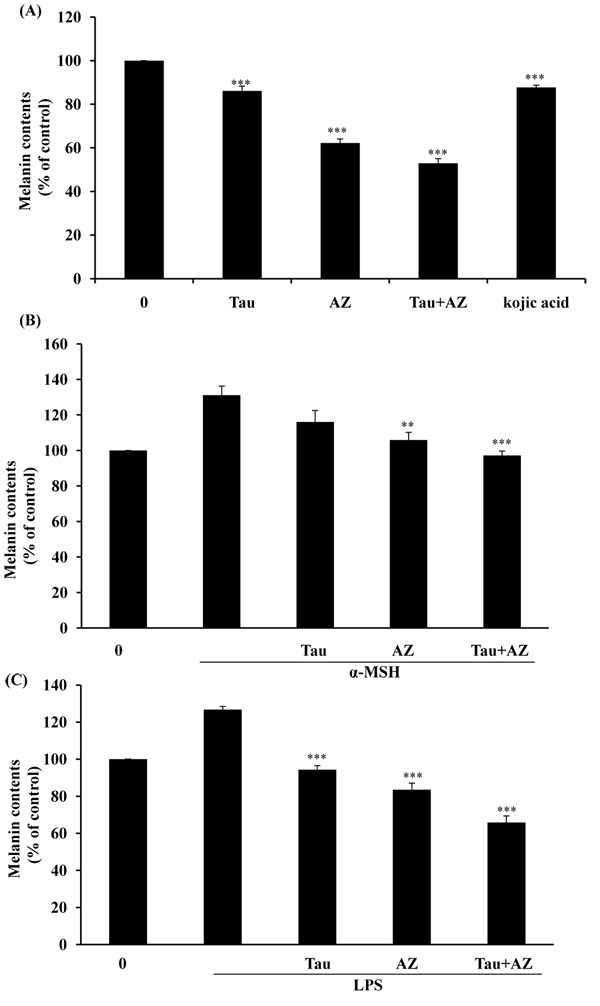
Figure 3.
Melanin contents in B16F10 cells. (A) After incubation with Tau (20 mM), AZ (20 mM) or combination of Tau and AZ, melanin content was subsequently measured as described in the Material and Methods. B16F10 cells were incubated in the presence of (B) 100 nM of α-MSH or (C) 1 μg/ml of LPS and then treated for 24 hr with each drug. Total melanin content was expressed as % of control. Results are the means of three independent experiments. The bars represent the mean values ± SD of triplicate. **P< 0.01; ***P < 0.001 versus control values.

