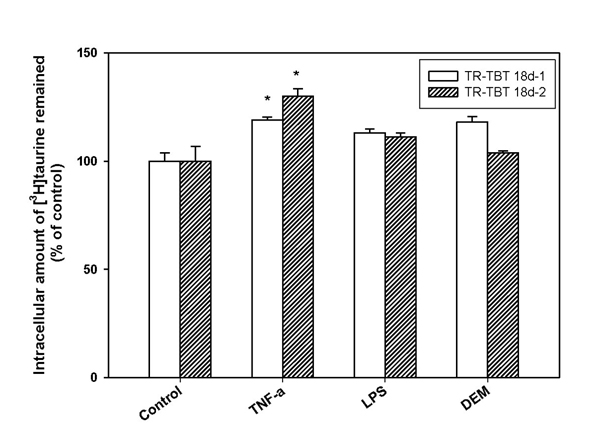
Figure 3.
Effect of oxidative stress inducing agents on [3H]taurine efflux by TR-TBT cells. Cells were pre-treated with several stimulants for the specific time showed maximal taurine uptake, TNF-α (20 ng/mL) for 9 hrs, LPS (10 ng/mL) for 9 hrs and DEM (100 μM) for 12 hrs, respectively and then [3H]taurine efflux was examined in TR-TBT 18d-1 (open bar) cells and TR-TBT 18d-2 cells (shaded bar). Each value represents the mean ± SEM (n=3). * p < 0.05, significantly different from control.

