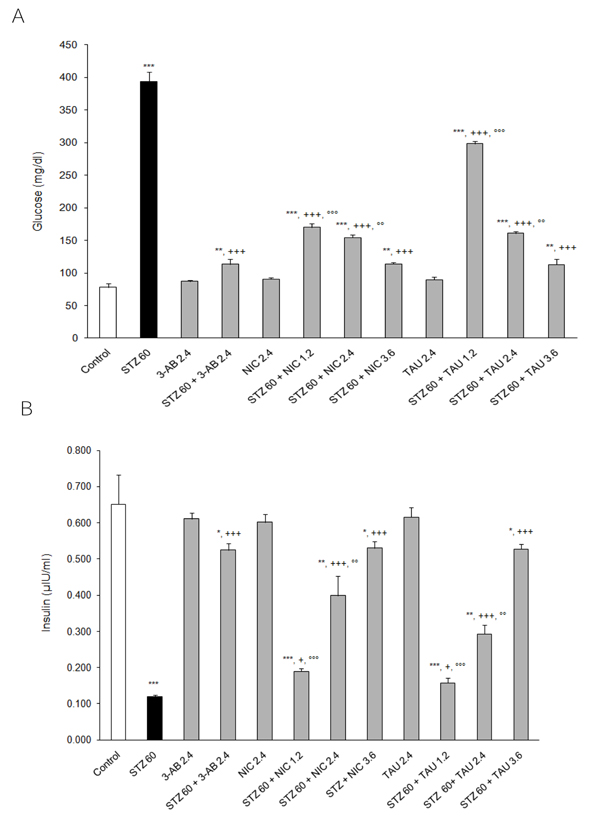
Figure 4.
Effects of 3-AB, NIC and TAU on plasma (A) glucose and (B) insulin of diabetic rats. Data are presented as mean ± S.E.M. for n = 6. Statistical comparisons were significantly different at **P<0.01 and ***P<0.001 vs. Control; at ++P<0.01 and +++P<0.001 vs. STZ; and at °P<0.05, °°P<0.01 and °°°P<0.001 vs. 3-AB.

