Figure 3.

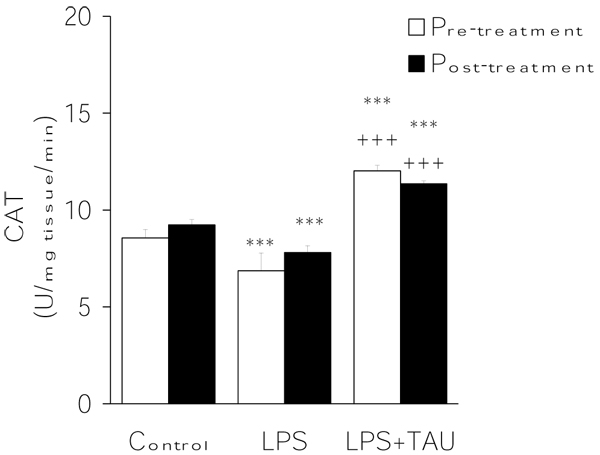
TAU attenuated the LPS-induced decrease in lung CAT activity when given before or after LPS. Each bar represents the mean ± S.E.M. for n = 6. ***P<0.001 vs. control; +++P<0.001 vs. LPS.

TAU attenuated the LPS-induced decrease in lung CAT activity when given before or after LPS. Each bar represents the mean ± S.E.M. for n = 6. ***P<0.001 vs. control; +++P<0.001 vs. LPS.