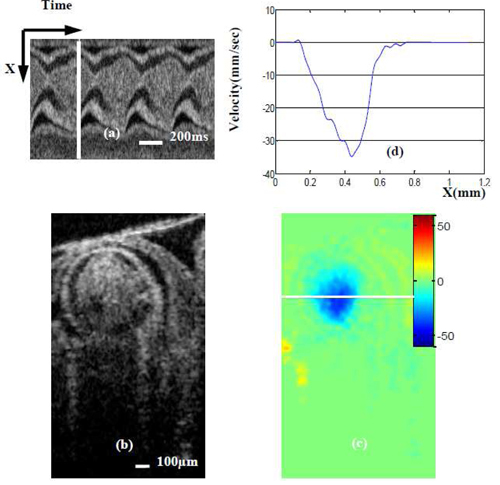
Fig. 6.

Maximum blood flow velocity near the OFT inlet. (a) M-mode image extracted from the sequence of cross-sectional images (one row over time). White line in (a) denotes the phase (time) of the cross-sectional images (b) and (c); (b) OCT structural image; (c)absolute velocity distribution image (obtained from Doppler SDOCT after correction for DF); (d) velocity profile across the white line [on (b)] of OFT.
