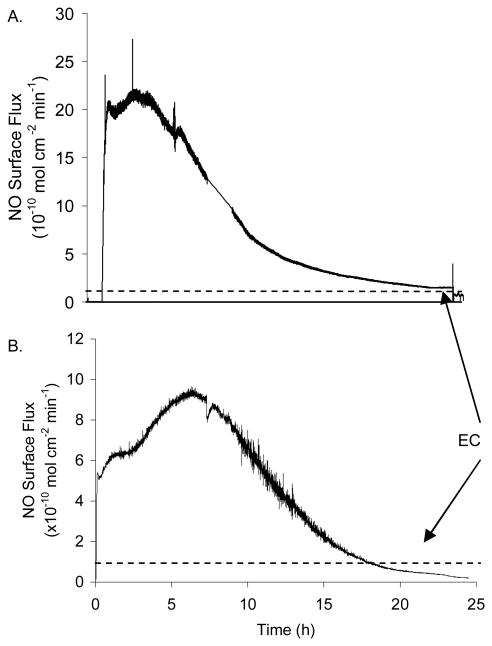
Fig. 3.
Representative NO surface flux of poly3 (A) and poly5 (B) for coatings (150-μm thickness) on 8 mm diameter tubings. NO release was measured directly via chemiluminescence in PBS (pH 7.4) at 37 °C. The dotted horizontal lines denote the levels that are produced by the normal endothelium (EC).

