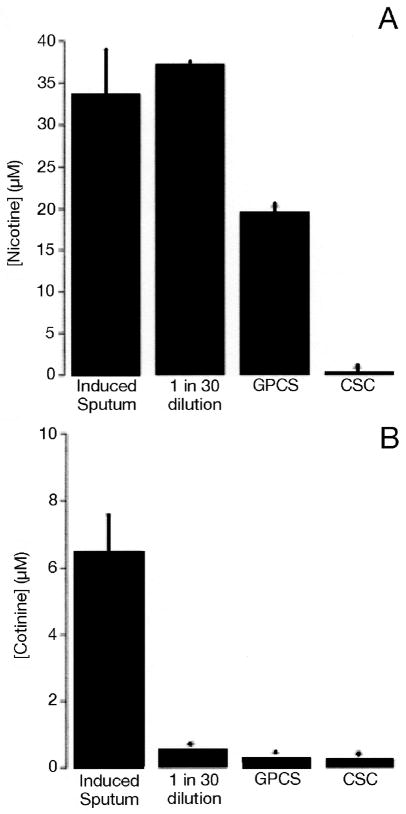
Figure 4.
Concentrations of nicotine and cotinine in airway epithelial cells (in vitro) versus induced sputum (in vivo) after cigarette smoke exposure. ASL was obtained by lavage in vitro or following induction of sputum in vivo. Nicotine in induced sputum (33.6 ± 5.5 μM); 1:30 dilution of WCS (37.1 ± 0.2 μM); GPCS (19.4 ± 0.1 μM); CSC (0.1 ± 0.007 μM) (A). Cotinine in induced sputum (6.5 ± 1.1 μM); 1:30 dilution of WCS (0.5 ± 0.02 μM); GPCS (0.3 ± 0.01μM); CSC (0.2 ± 0.01 μM) (B). n = > 4 for all conditions.

