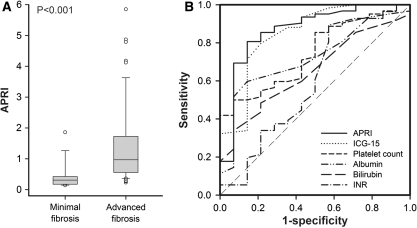
Fig. 1.
aBox and whisker graph shows the relationship between the stage of fibrosis and the APRI. The middle horizontal line inside each box depicts the median, and the width of each box represents the 25th and 75th percentiles. Vertical lines represent the 10th and 90th percentiles. b Receiver operating curves (ROCs) of APRI, ICG-15R, albumin, bilirubin, platelet count and prothrombin time INR for the prediction of advanced fibrosis in patients with small and solitary HCC

