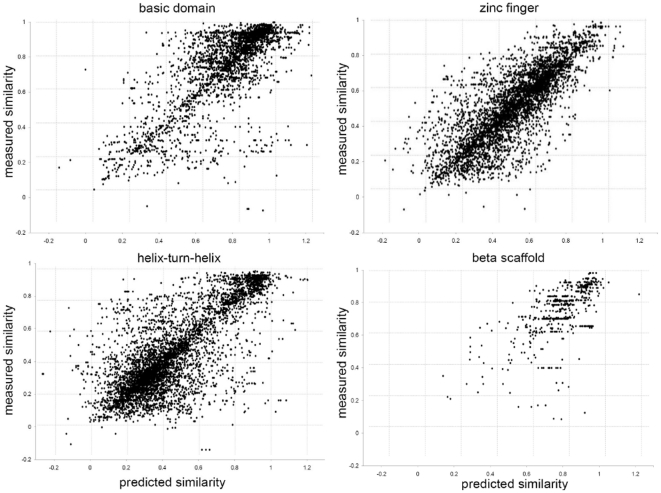
Figure 4. Predicted versus experimental similarities for different structural superclasses.
Each dot indicates the predicted and known PFM similarity of all TF-pairs in the test dataset. The  -axis gives the sequence based SVR-based PFM similarity prediction and the
  -axis gives the similarity of their known PFMs. Thereby, for each structural superclass the best SVR model from the training dataset was used for the predictions. The Pearson correlation-coefficients are as follows: basic domain: 0.77, zinc finger: 0.80, helix-turn-helix: 0.77 and beta-scaffold: 0.64.

