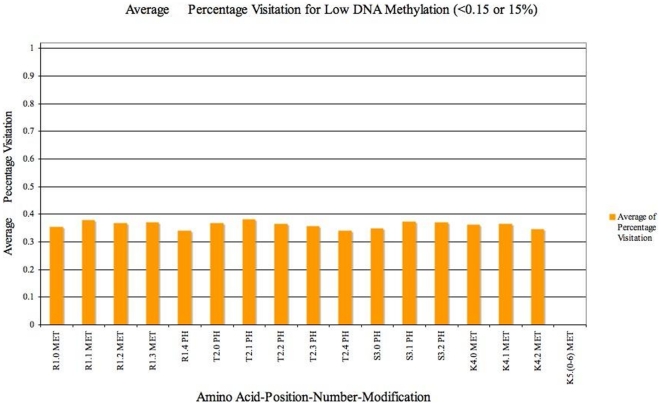
Figure 6. Analysis of Average percentage visits of H3 histone states containing Lysine Acetylation .i.e K6 in 16 promoters after 5000 iterations (for low levels of DNA Methylation (<0.15 or 15%)).
States containing Lysine acetylation are visited the most. Hence we analyse the the average of percentage visitation of model to all other modifications (except Lysine Acetylation - K6 in Figure) during the simulation. Here each unit in the X-axis represents an amino acid–position in H3 array–number of Amino acids–Modification possible. The Y axis elaborates on the average percentage visitation of H3 states that contain the modification depicted in each unit of X axis.

