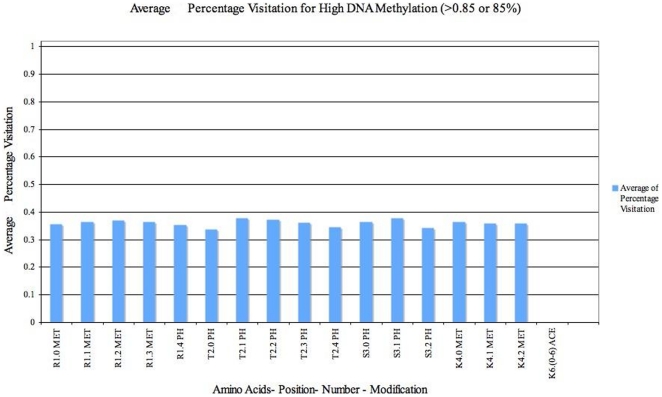
Figure 7. Analysis of Average percentage visits of H3 histone states containing Lysine Methylation i.e. K5 in 16 promoters after 5000 iterations (for high levels of DNA Methylation (<0.85 or 85%)).
States containing Lysine Methylation are visited the most. Hence we analyse the average of percentage visitation of model to all other modifications (except Lysine Methylation K5) during the simulation. Each unit in the X-axis represents an amino acid–position in H3 array–number of Amino acids changeable–Modification. The Y axis elaborates on the average percentage visitation of H3 states that contain the modification given on the X axis.

