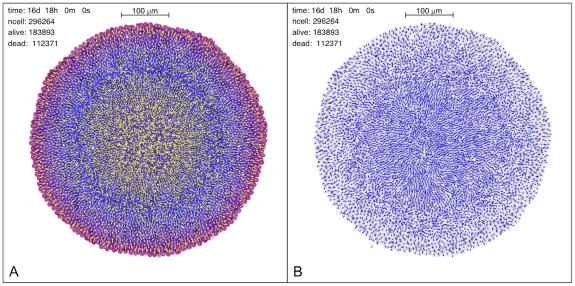
Figure 8. Two views of the microstructure of a simulated spheroid, with about  diameter and 296264 cells (183893 live cells+112371 dead cells).
(Left panel): flow of extracellular glucose along a central section of the tumor spheroid (yellow arrows) superposed on the plot of glucose concentration. The length of the arrows is proportional to the glucose flow intensity projected on the plane of the section. At this stage, the necrotic core is contracting as dead cells gradually shrink, and this leads to a slow outward flow of the glucose stored in the extracellular spaces in this central region. We observe that such a behavior depends on the effective diffusion coefficient of glucose, and it disappears completely when the diffusion coefficient is high enough. This also suggests that the flow of glucose and other substances, like therapeutic drugs, is strongly dependent on the biochemistry and structure of extracellular spaces, and even small changes can lead to markedly different internal spheroid morphologies. (Right panel): individual cell velocities in the simulated spheroid. This is the same central section as in the left panel, and the velocity vectors are projected on the plane of the section. The length of each vector is proportional to the projected speed. The velocities in the viable rim show a coherent outward motion, while the velocities in the necrotic core show a rather orderly inward motion, with some vortices due to local residual cell proliferation. The region in-between is somewhat chaotic and the global structure of this plot mirrors that of the glucose flow shown on the left. The supporting information includes higher-quality versions of these figures and those of other flows.

