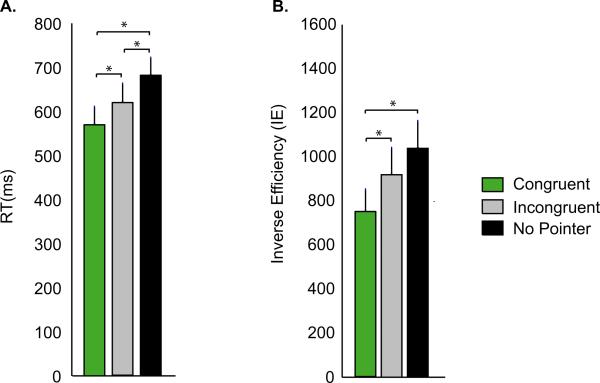
Fig. 2.
Behavioral performance during the three trial types. (A) The average RT across subjects during each trial type (error bars show SEM across subjects). Each trial type is identified by a different color, as shown in the legend; only correct trials were included in the analysis. *P < 0.05. (B) The average IE (defined as RT/accuracy) across subjects.

