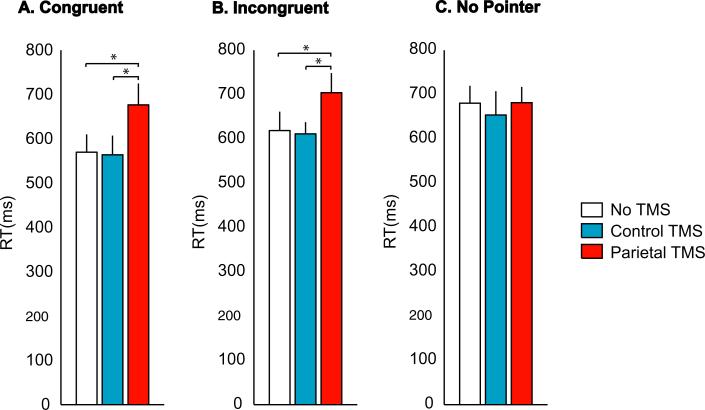
Fig. 4.
Behavioral performance during the three trial types and three TMS conditions. (A) The average RT across subjects to Congruent Pointer trials. Each color corresponds to a different TMS condition, as shown in the legend. Only correct trials were included in the analysis. (B) RT to Incongruent Pointer trials during the different TMS conditions. (C) RT to No Pointer trials during the different TMS conditions. *P < 0.05.

