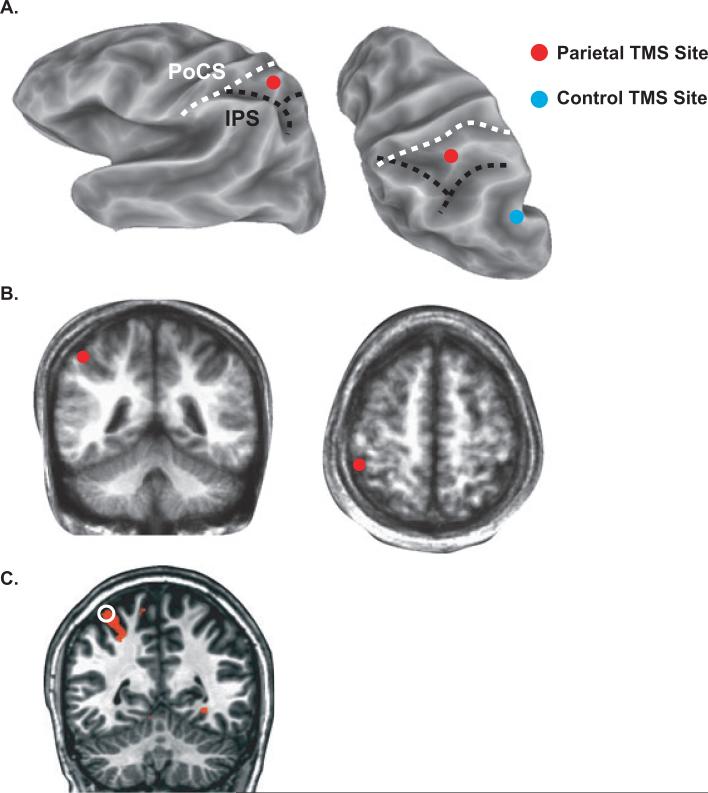
Fig. 5.
The anatomical location of TMS as measured with neuro-navigation. (A) A partially inflated cortical surface model of one subject's left hemisphere is shown from a lateral view (left) and superior–posterior view (right). The fundus of the intraparietal sulcus (IPS) is shown with a black dashed line. The fundus of the postcentral sulcus (PoCS) is shown with a dashed white line. The red circle shows the location of posterior parietal cortex (PPC) TMS, the blue circle shows the location of control TMS. (B) The average location of PPC TMS (red circles) plotted on an average anatomical volume created by averaging each subject's anatomical MRI in standard space, shown in coronal (left) and axial (right) sections. (C) Location of TMS in a single subject (white open circle) with blood oxygenation level-dependent (BOLD) fMRI activation to viewed and felt touches (orange color).

