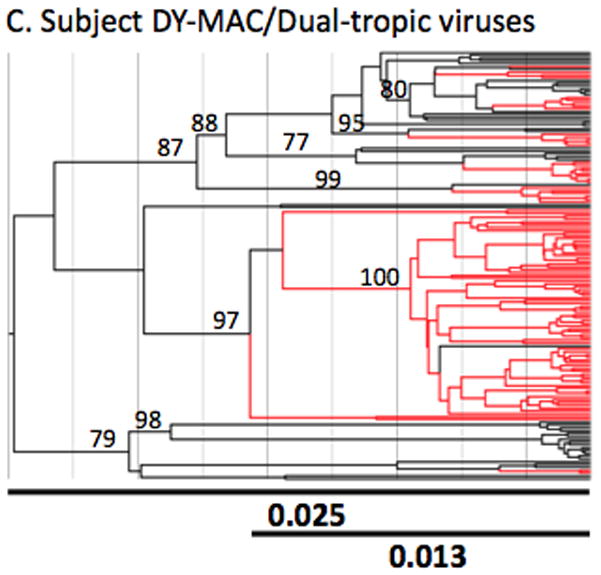
Figure 3. Bayesian phylogenetic analysis of nef proteins from sequences derived from lymphoid and non-lymphoid tissues.


The Bayesian MAP trees were inferred as detailed in the methods section. The subject name appears above each analysis (Panels A-E). Tropism for patient DY was not determined experimentally and was implied by computational tests and viral behavior. Branches containing sequences generated from non-lymphoid (brain) tissues are shown in red whereas those generated from lymphoid tissues are shown in black. Branch lengths are drawn in scale proportional to nucleotide substitutions per site. The two lines at the bottom of each tree represents the length of the entire tree (top line) and the length of the tree up to the earliest brain clade (bottom line) in units of nucleotide substitutions per site (bold numbers). Each number along an internal branch represents the posterior probability for that branch. Only posterior probabilities >75% are indicated.
