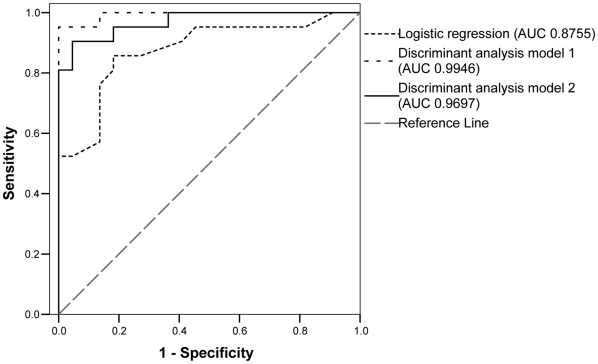
Figure 1. Receiver operating characteristic (ROC) curves for the multivariate logistic regression analysis and discriminant analysis models.
AUC, area under the ROC curve; Sensitivity, proportion of responders which are correctly identified; Specificity, proportion of non-responders which are correctly identified. Variables included in the models in decreasing order of significance: logistic regression model, Core amino acid pattern and nHap_E1–E2; discriminant analysis model 1, Core amino acid pattern, nHap_E1–E2, Sqrt(GGT quotient), Sqrt(ALT quotient), Log(viral load), Sqrt(S_HVR-2), body weight, and Log(Ks_E1–E2); discriminant analysis model 2, Core amino acid pattern, nHap_E1–E2, Sqrt(GGT quotient), Sqrt(ALT quotient), nHap_HVR-1, and Sqrt(Ks_HVR-1), and body weight.

