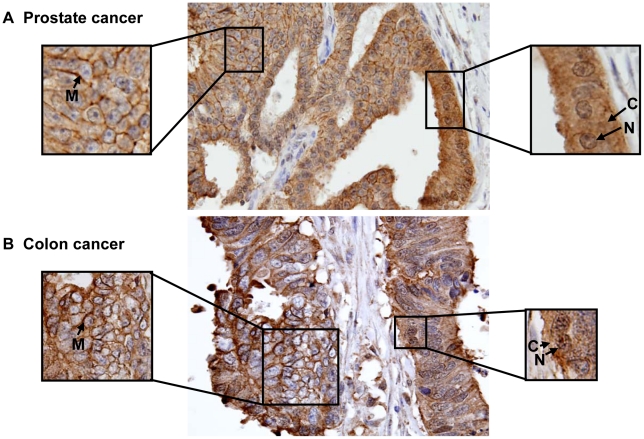
Figure 3. Immunohistochemical analysis of Ep-ICD expression in prostate and colon cancers.
Membrane, cytoplasmic, and nuclear Ep-ICD expression in prostate cancer (A) and colon cancer (B). Some areas of the tissue section show predominant membrane and weak cytoplasmic but no nuclear localization of Ep-ICD (A, B - left square), while the other areas of the same tissue section show nuclear and cytoplasmic accumulation of Ep-ICD with absence of membranous Ep-ICD expression (A, B - right square). Original magnification ×400.

