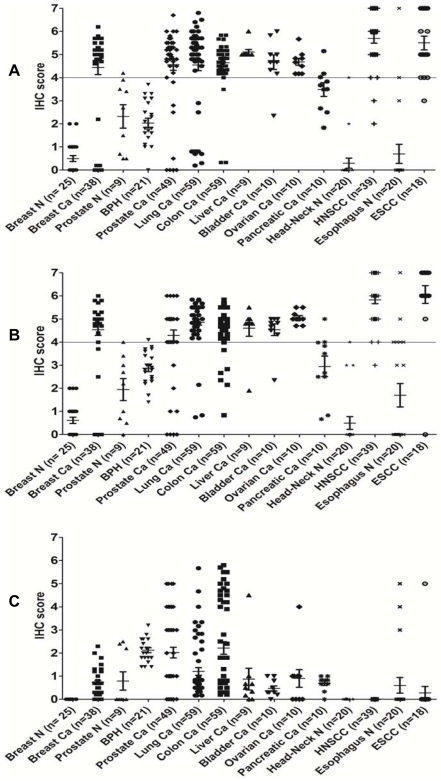
Figure 5. Scatter plot analysis of Ep-ICD membrane, cytoplasmic, and nuclear expression.
Scatter plots showing distribution of total immunostaining scores determined by IHC of tissue sections of cancers of the breast (n = 38), prostate (n = 49), lung (n = 59), ovary (n = 10), colon (n = 59), bladder (n = 10), liver (n = 9), positively-staining HNSCCs (n = 39) and ESCCs (n = 19), and normal breast (n = 25), prostate (n = 9) and BPH (n = 21), normal esophageal (n = 20), and head and neck (n = 20) tissues. The vertical axis gives the total IHC score as described in the Methods. A cutoff of ≥4 was used to determine positivity. N, normal; Ca, cancer. A. Increased nuclear accumulation of Ep-ICD was observed in most of the epithelial cancers analyzed. B. Increased cytoplasmic accumulation of Ep-ICD was observed in almost all epithelial cancers analyzed. C. Membrane localization of Ep-ICD varied in the different cancer and normal tissue types examined.

