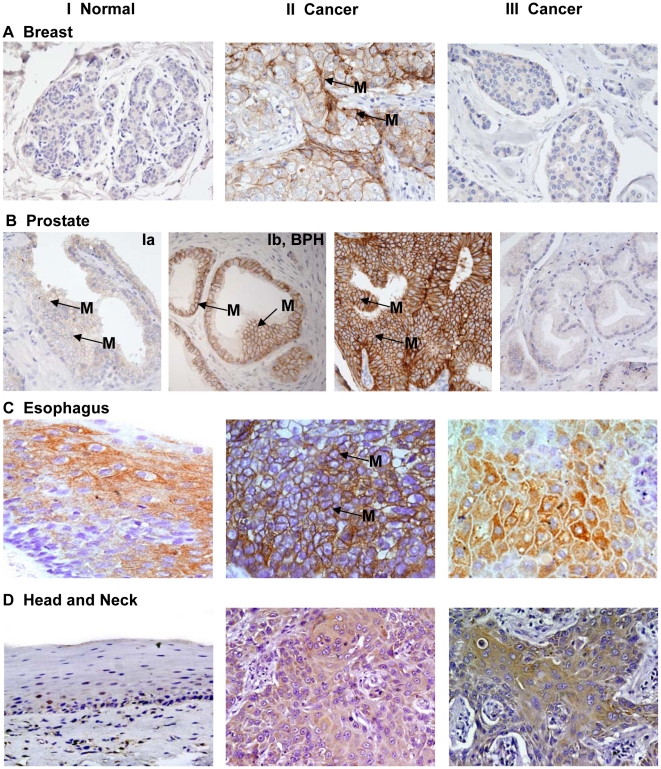
Figure 6. Immunohistochemical analysis of EpEx expression in epithelial cancers.
The photomicrographs depict MOC31 stained membrane EpEx in epithelial cancers. The panel I shows low level of membrane EpEx expression in normal breast (A) and prostate (B, Ia), BPH (B, Ib), and normal esophagus (C) and head and neck (D) tissues. The corresponding cancer tissues depicting increased level of EpEx in the membrane are shown in panel II (A–D). In contrast many of the cancer tissues of each cancer type showed absence of membrane EpEx (panel III, A–D). Original magnification ×400.

