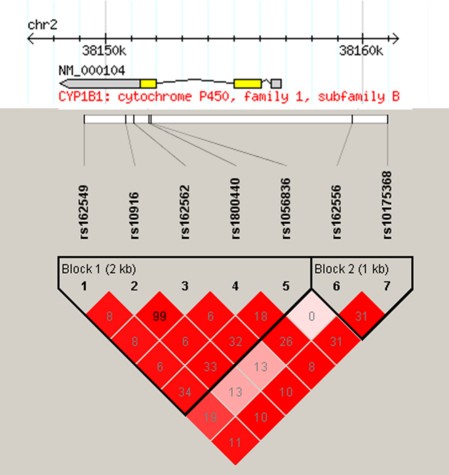
Figure 1.
Linkage disequilibrium pattern between tag SNPs typed in the CYP1B1 gene. R2 values are given in the intersecting boxes, with darker colors indicating stronger linkage disequilibrium. The position of each SNP relative to the gene is indicated. Figure generated in Haploview [19].

