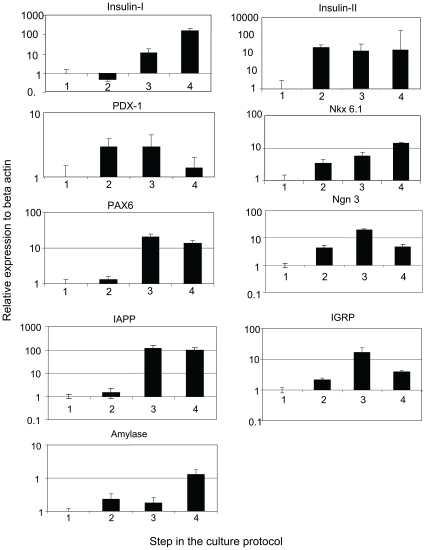
Figure 3. Quantitative PCR results of pancreatic markers (insulin-I, insulin-II, IAPP, IGRP, amylase, PDX-1, Nkx 6.1) and endocrine markers (PAX6 and Ngn 3) in the cells cultured by the protocol.
The expression of each gene is illustrated as expression of SYBR green (semi-log scale in the Y-axis) relative to its levels in ES cells (1).

