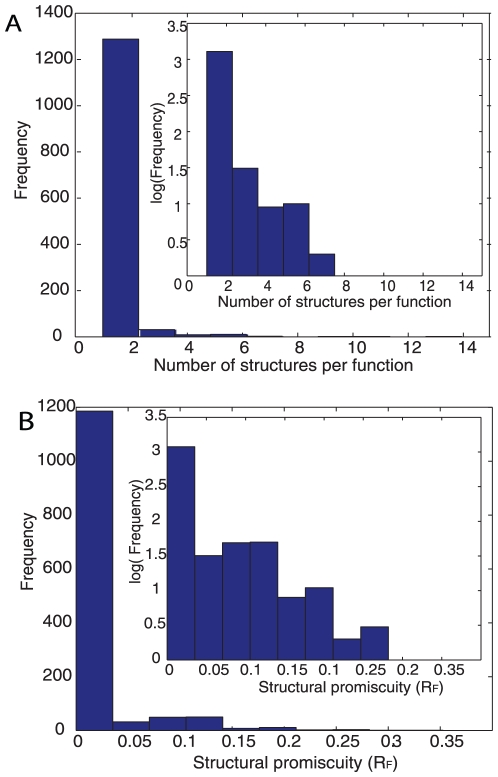
Figure 1. Distribution of structures over functions.
(a) Distribution of the number of structures associated with a particular function. The total number of different structures (457) in our dataset composed of 39.529 sequences are classified according to the enzyme function that they perform and counted (min = 1 ; max = 14 ; mean = 1.2). The inset shows the same distribution, but with a log10-transformed vertical axis. (b) Distribution of structural promiscuity. Structural promiscuity (RF) is an entropy-like measure (see main text) calculated from the distribution of enzyme functions over different protein domains. The data shown is based on the finest-grained, fourth level of the EC hierarchy. (min = 0.0; max = 0.35; mean = 0.01).

