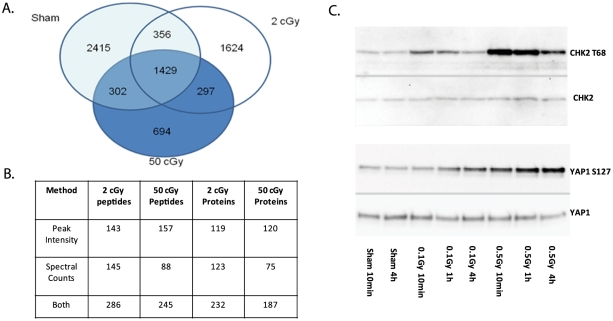
Figure 1. Summary of phosphoproteomic data.
A. Venn diagram showing the distribution of phosphopeptides in sham, 2 cGy and 50 cGy treated cells. B. Quantitation of significantly altered peptides using peak intensities and spectral counting methods. C. Validation of YAP1 S127 phosphorylation by Western blotting. YAP1 S127 phosphorylation increases over time at both the lower and higher dose while CHK2 T68 phosphorylation peaks at earlier timepoints. The same samples probed with YAP1 and CHK2 antibodies showed no changes in YAP1 or CHK2 total protein at these timepoints.

