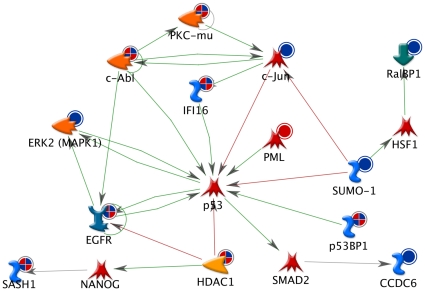
Figure 4. p53 regulatory network affected by radiation exposure.
The blue dots adjacent to specific proteins indicate phosphorylation change by low dose, red dots indicate phosphorylation change by high dose, and red/blue hatched dots indicate change by both dose groups. Green edges (lines) between proteins indicate activation of the protein at the head of the arrow, and red edges indicate inactivation.

