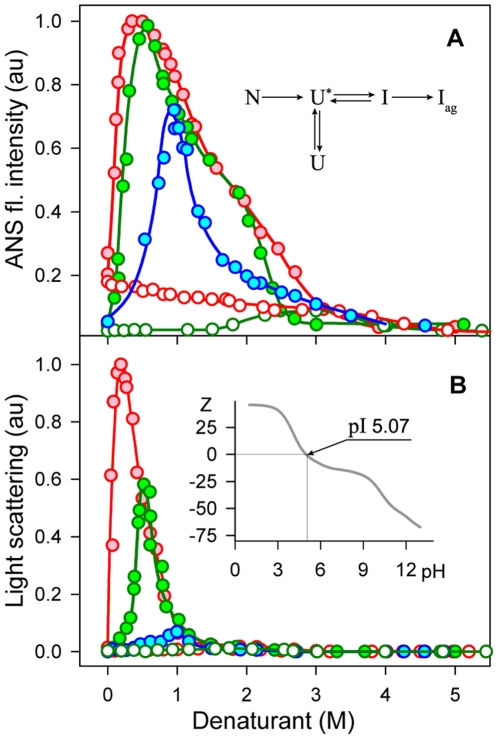
Figure 1. Actin aggregation induced by GdnHCl in low concentrations.
The dependence of ANS fluorescence intensity (A) and of light scattering (B) of the solutions of inactivated actin (red) and initially native actin after 10 min and 24 h of incubation in a solution of denaturants at the appropriate concentration (blue and green) on GdnHCl (closed symbols) and urea (open symbols) concentration. Insert in panel A. Scheme of actin denaturation and aggregation (N, U* and I are native, essential unfolded and inactivated actin [11], Iag is aggregates of inactivated actin, the details are given in the text). Insert in panel B. The dependence of the total macromolecule charge of actin on the pH of a solution calculated on the basis of protein amino acid content [24]. The protein concentration was 0.15 mg/ml, ANS concentration was 5⋅10−5 M.

